When Things Turn Around
It seems like every few months I post this chart from Dimensional and remind everyone within shouting distance that the stock market’s long-term average return doesn’t look anything like the return you should expect to see in any given year. As this chart tells us, the annual return for the S&P 500 index came within two percentage points of the market’s long-term average of 10% in just seven of the past 96 years.
I mention this here, because when the market eventually turns around, which I strongly believe it will, the least likely scenario is a slow, steady, 8% annual climb higher. Instead, history tells us that things change quickly.
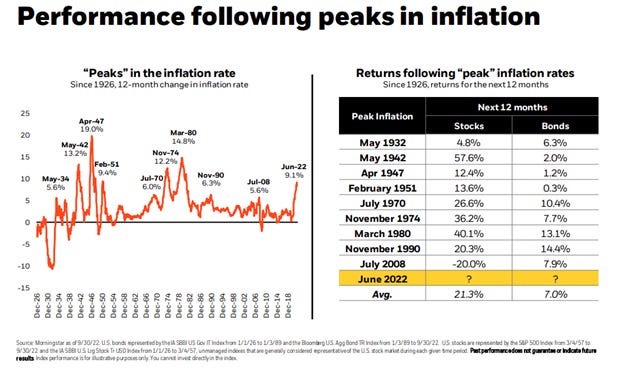
There are no facts about the future. However, history (and the above chart) indicate that when inflation peaks, the market tends to do well over the next 12 months. Of course, none of us know when inflation will peak and I’m very confident bells won’t go off when the market bottoms, so as long-term investors, the only thing we can do is stay invested.
Finally, in the words of my favorite financial writer, Nick Murray:
“If you invest and the equity market goes down 20%, you may regret that for a matter of months. If the market runs away from you and you freeze, you’ll end up regretting it for the rest of your life.”


When it comes to writing about investments, the disclaimers are important. Past performance is not indicative of future returns, my opinions are not necessarily those of TSA Wealth Management and this is not intended to be personalized legal, accounting, or tax advice etc.
For additional disclaimers associated with TSA Wealth Management please visit https://tsawm.com/disclosure or find TSA Wealth Management's Form CRS at https://adviserinfo.sec.gov/firm/summary/323123