


Taking the Good with the Bad

A lot has happened since last Friday’s note. First, the stock market had its largest two-day decline in 75 years, which caused many investors to sell (either because they were panicked or their technical sell signals were triggered) *. Then, on Wednesday, the market made an about-face, and the S&P 500 climbed 9.52%, the 8th largest percentage gain in history. This was then followed by a 5%+ intraday decline on Thursday.
While today’s headlines may seem historically unprecedented, the market volatility is similar to what we’ve seen in the past.
First, in the chart below, the blue dots represent the 25 best days in the stock market, and the green dots represent the 25 worst days.
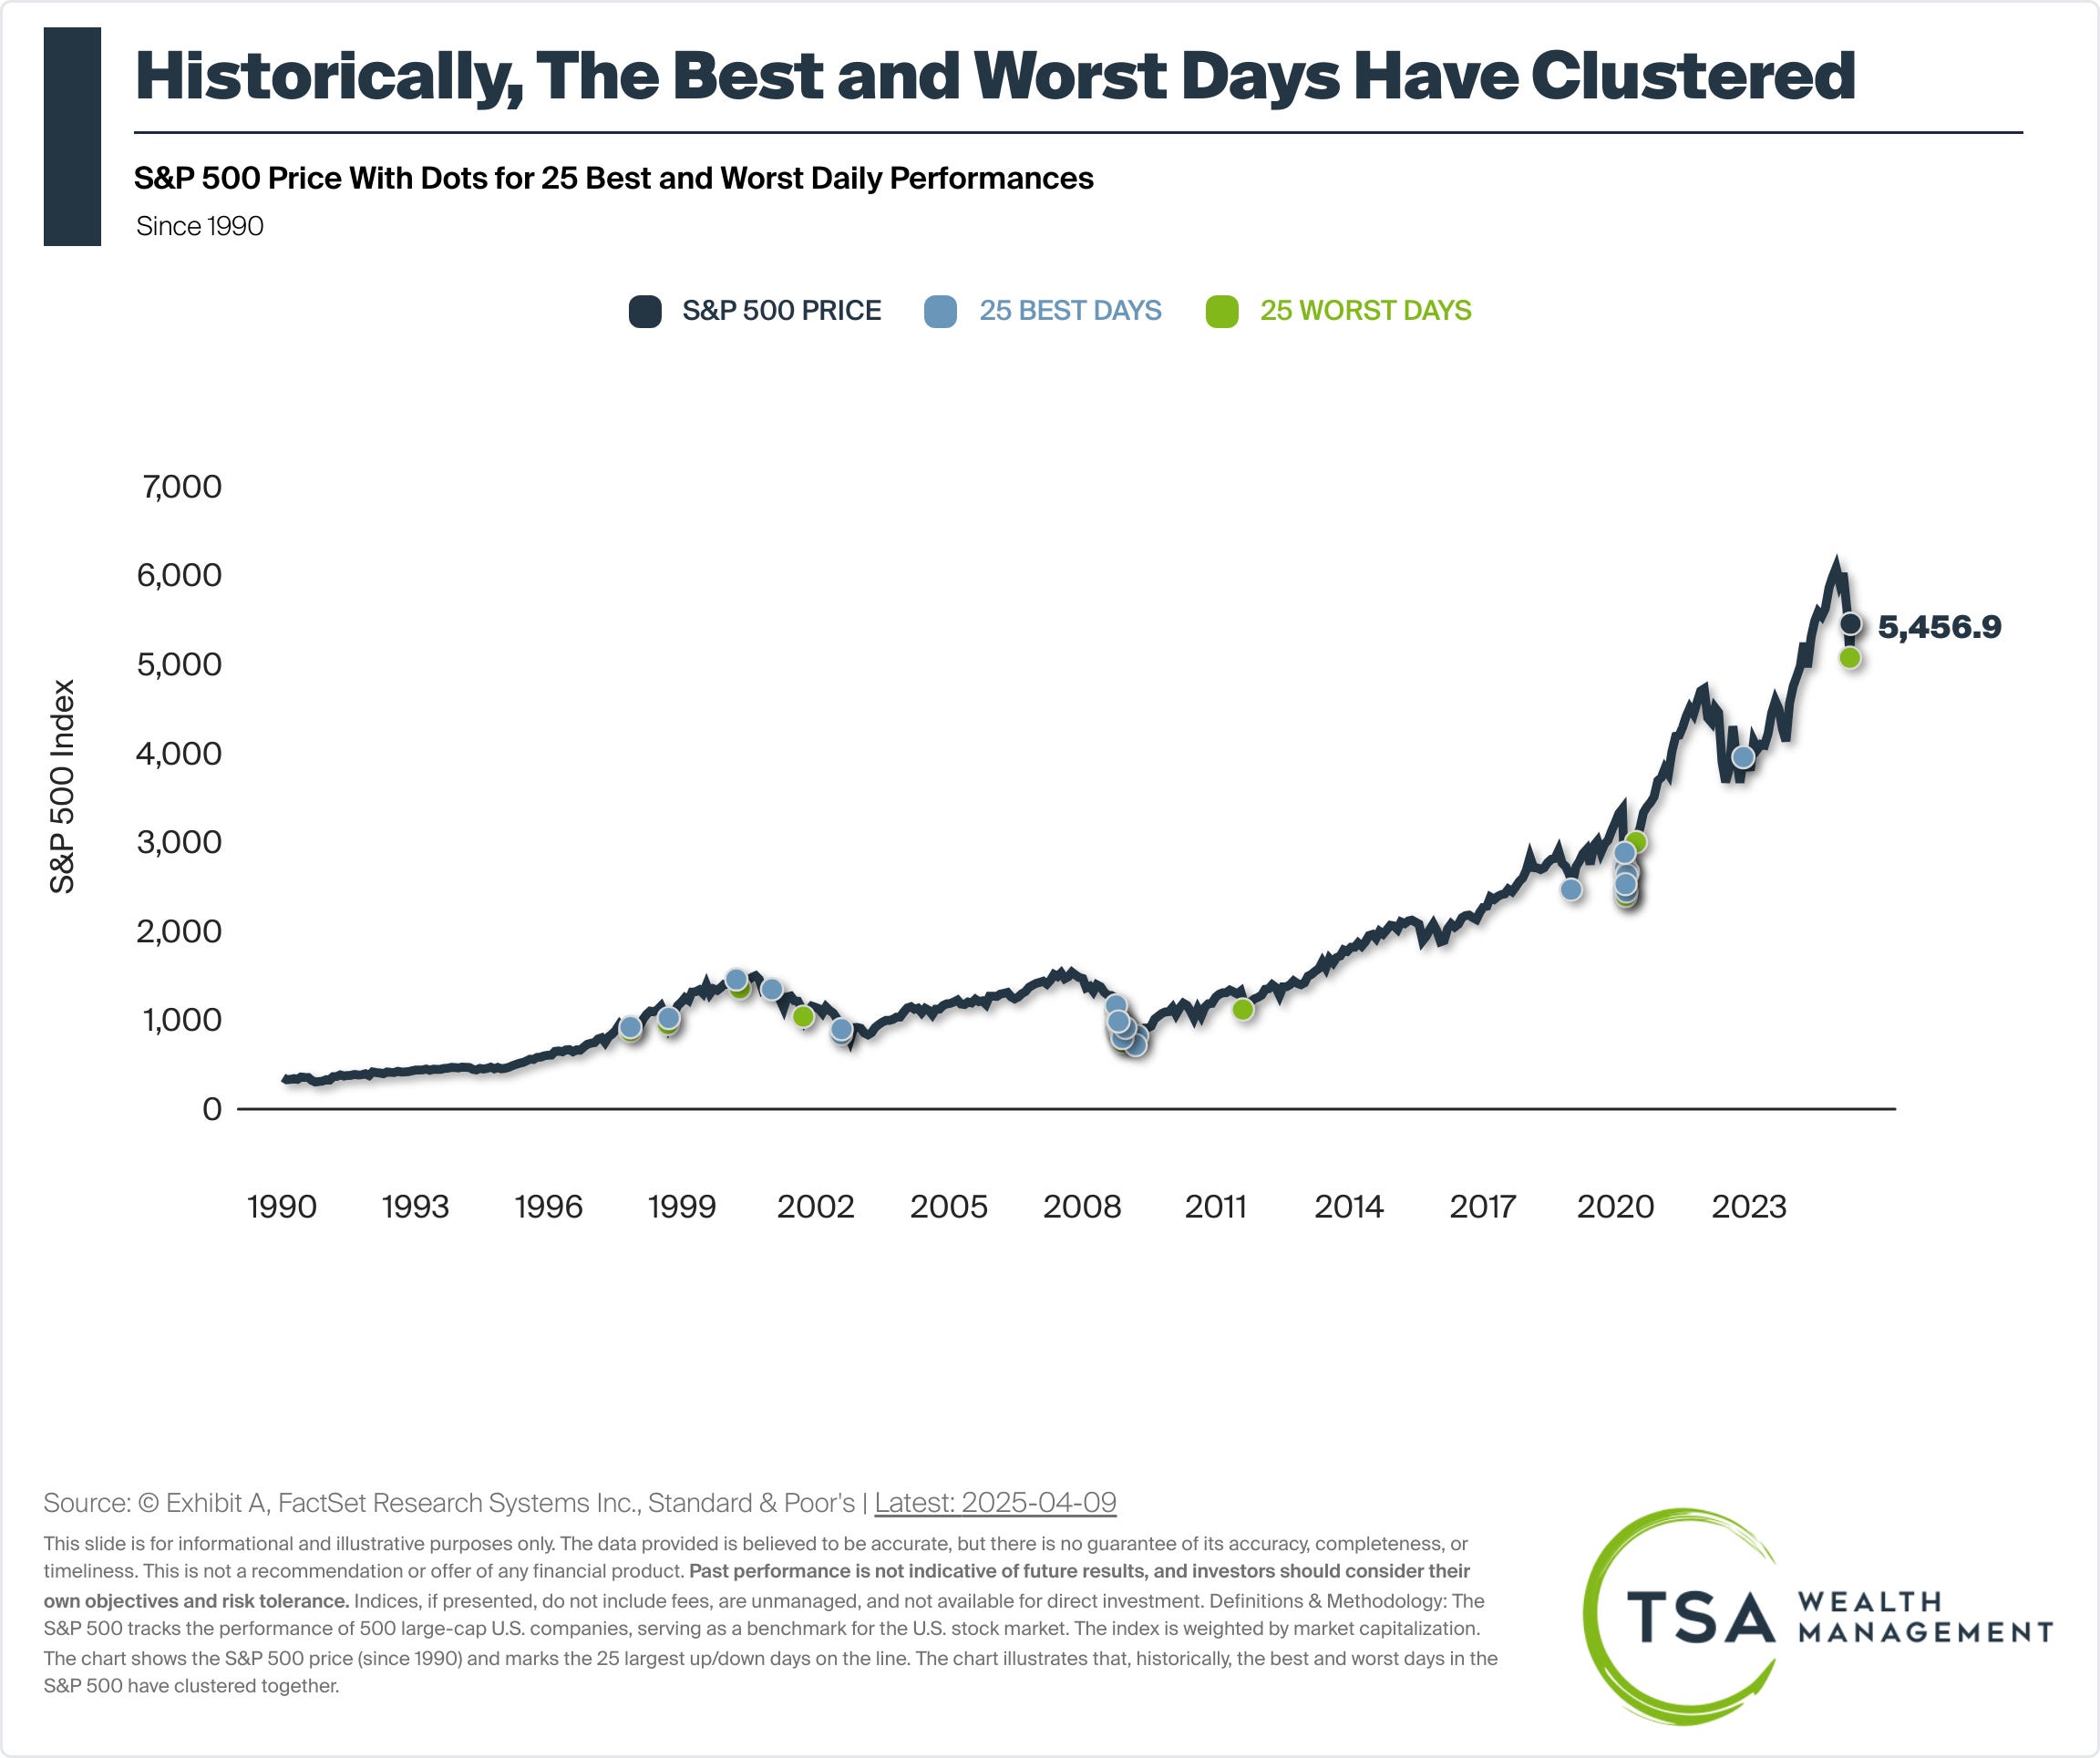
If you are saying to yourself, “I don’t see 25 green dots!” It is because they are directly underneath the blue dots. This chart only goes back to 1990, but the same thing that was true during COVID, the Financial Crisis, and the Dot-Com Bubble was also true for Black Monday and the Great Depression. Typically, the best and worst days in the market happen days apart.
Why Does This Matter?
People like to talk about the stock market generating 8%+ returns per year, but it is important to remember that this return is primarily the result of a few very good days offsetting a lot of very bad days. As the chart below illustrates, going back to 1950, if an investor missed the one best trading day of the year, the average annual return dropped to 4.6%. If they missed the five best trading days of the year, the return fell to a negative 4.5% / year. If they missed the ten best trading days of the year, the average annual return dropped to a negative 12.4%.

Good things and bad things are bound to happen, and you cannot expose yourself to the full benefit of one without feeling the full pain of the other. That’s how stock ownership has always been and how it will always be.
Fortunately, the world rarely ends, and while we expect to see more volatility in the days, weeks, and months ahead, if history is to be any indicator, this too shall pass.
*People often ask if we use stop losses or technical indicators as sell signals to limit trading declines. The short answer is no. We believe these strategies tend to automate the destructive process of selling low and buying high. This type of trading does not make sense for our long-term assets, where our primary concern is long-term return. For funding shorter-term goals, in our opinion, relying on lower volatility investments (with lower potential upside) makes more sense than applying a market timing strategy to higher volatility assets.
Last weekend’s crawfish boil in support of Jenni’s Rescue Ranch was a success. However, I volunteered to help, and they found my skills (and height) best suited to walking around in a dog costume.

When it comes to writing about investments, the disclaimers are important. Past performance is not indicative of future returns, my opinions are not necessarily those of TSA Wealth Management, an SEC-registered investment advisor, and this is not intended to be personalized legal, accounting, or tax advice etc.
For additional disclaimers associated with TSA Wealth Management please visit https://tsawm.com/disclosure or find TSA Wealth Management's Form CRS at https://adviserinfo.sec.gov/firm/summary/323123
Doggone good